FY 2017 - FY 2019 Actual Revenue & Expenditures Comparison
Jump to: Expenditures by Program
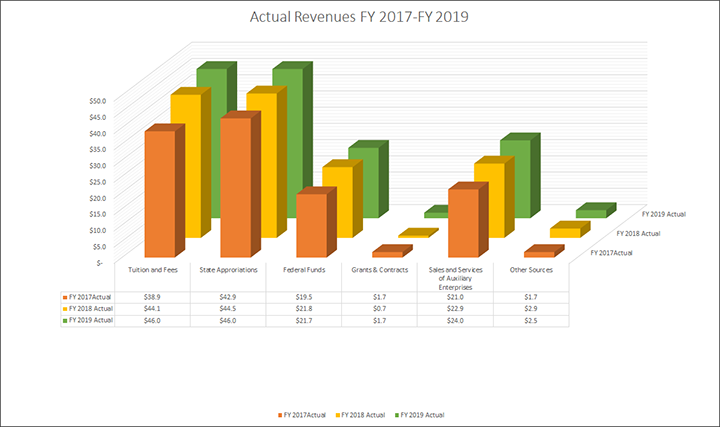
Source of Revenue (Actual: In Millions)
FY 2017
|
FY 2018 |
FY 2019 |
Average |
% |
|
| Tuition and Fees | $38.9 | $44.1 | $46.0 | $43.0 | 31.9% |
| State Appropriations | $42.9 | $44.5 | $46.0 | $44.5 | 33% |
| Federal Funds | $19.5 | $21.8 | $21.7 | $21.0 | 15.6% |
| Grants and Contracts | $1.7 | $0.7 | $1.7 | $1.4 | 1.0% |
| Sales and Services of Auxiliary Enterprises | $21.0 | $22.9 | $24.0 | $22.6 | 16.8% |
| Other Sources | $1.7 | $2.9 | $2.5 | $22.4 | 1.8% |
| TOTAL | $125.7 | $136.9 | $141.9 | $134.8 | 100% |
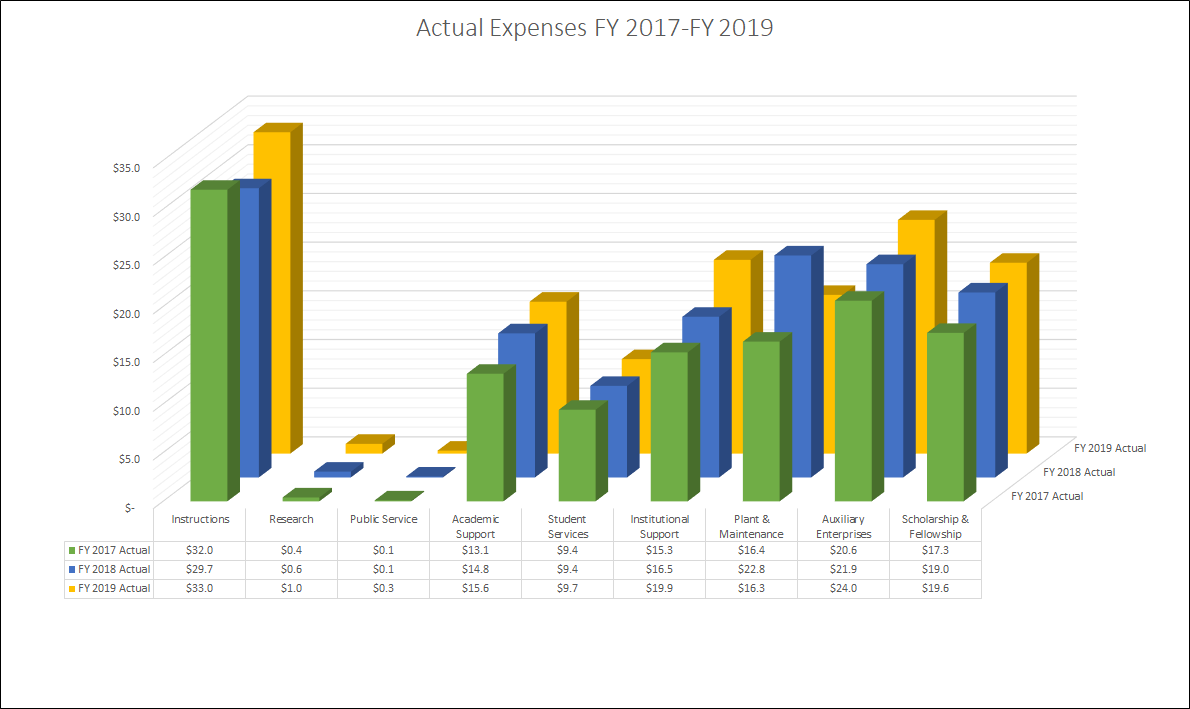
Expenditures by Program (Actual: in Millions)
FY 2017 |
FY 2018 |
FY 2019 |
Average |
% |
|
| Instructions | $32.0 | $29.7 | $33.0 | $31.6 | 23.7% |
| Research | $0.4 | $0.6 | $1.0 | $0.7 | 0.5% |
| Public Service | $0.1 | $0.1 | $0.3 | $0.2 | 0.1% |
| Academic Support | $13.1 | $14.8 | $15.6 | $14.5 | 10.9% |
| Student Services | $9.4 | $9.4 | $9.7 | $9.5 | 7.1% |
| Institutional Support | $15.3 | $16.5 | $19.9 | $17.2 | 13.0% |
| Plant & Maintenance | $16.4 | $22.8 | $16.3 | $18.5 | 13.9% |
| Auxiliary Enterprises | $20.6 | $21.9 | $24.0 | $22.2 | 16.7% |
| Scholarship & Fellowship | $17.3 | $19.0 | $19.6 | $18.6 | 14.0% |
| TOTAL | $124.6 | $134.8 | $139.4 | $132.9 | 100% |
*Revenues and expenditures include unrestricted and restricted funds